Some social media statistics
51 blog posts, 191 Facebook updates (66 links, 83 photos, 48 text statuses), 136 instagrams and 184 tweets since the beginning. I've been working a lot with data lately, so I figured I could do dig out some data about our activity in this blog and other social media sites.
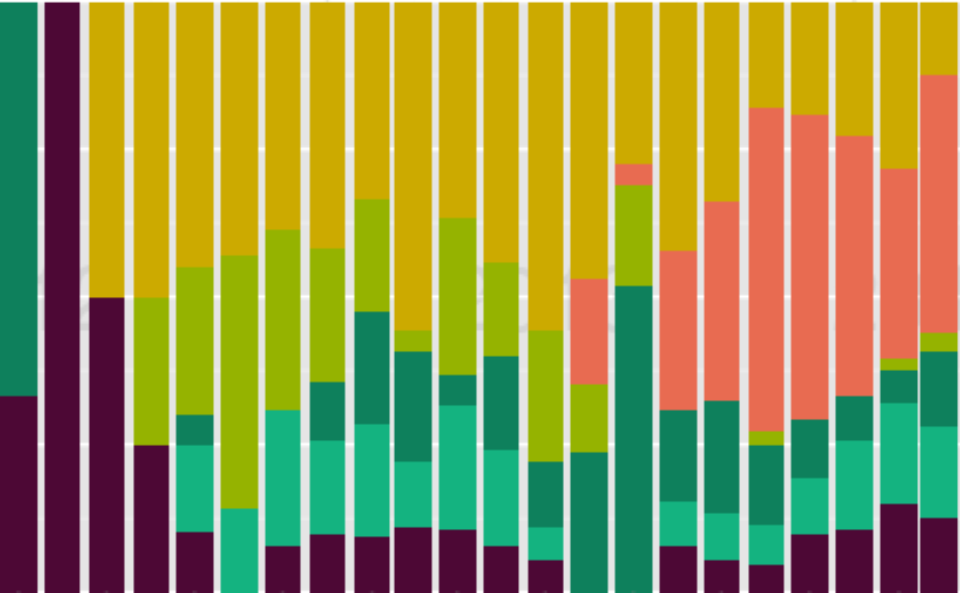
The following three graphs show our activity in three different ways. The top one shows one dot per action, the middle on shows total activity per month, and the bottom one shows the relations of monthly activity amounts in different channels. The time span is from June, 2012 to this Friday, March 14th, 2014.

There are three quite distinct periods that can be seen in the two lower pictures. I like to look at them as shifting gears.
In 2012, in the pre-nomad period, we first kept low profile until we published our Facebook page in October. We were quite quiet all the way until the take-off in January 2013.
We started our trip full of enthusiasm, but we couldn't keep up the speed, and already in July/August our blog was completely silent. We didn't really know what to do with the blog and it didn't feel right the way it was.
We redesigned the blog and rethought our activities, and were back in the game at the end of September, with Instagram as a new channel. Rest of the year we managed to keep posting and updating, except for the two weeks we spent off the internet, crossing the Atlantic. That explains the low numbers as well, and the gap in the beginning of December. Our activities online were still irregular, and we had no clear plan.
Finally, in January 2014 we started to get our routines together. Although at first sight the beginning of the year might show a declining trend as well, it's not really so. January was exceptionally active with all the annual recaps. And the numbers for March contain only the fist half of the month. We've become quite a bit more efficient in all this, and I don't think we spend now much more time on this than we did half a year ago. We just seem to get more stuff done nowadays.
We created the Facebook page and reserved the name already in April 2012, but it wasn't before October that we actually felt ready to publish it. At first we posted status updates about once a week, but switched to photo updates after we got into Instagram. We also started to switch the cover photo to match the place we're currently in, that shows in the photo numbers. We always share links to our new blog posts. Our idea was to keep a steady flow of updates without much noise.
By numbers, we have most followers, 465 at the time of writing this, in Twitter. We aren't as active as we could be there though. We do tweet about our blog posts every time we write something, but we haven't been that active in retweeting and taking part in conversations. Still, even on the months there wasn't much else happening, you can see we have been active in Twitter.
We got an instagram account in July 2013, but really got into it in September and have been steadily posting since then. One of the main reasons for joining was that we wanted to take and share more photos, but we didn't want to flood our Facebook timeline with them. Instagram seemed like the right place to do that.
Blog
Starting a blog was clear for us from the beginning. We wrote a few posts before we even told anyone about it, because we thought it would be lame to promote a blog with just one post in it. We took it all a bit too seriously in the beginning, now that I think of it. There were many posts that didn't get written, because we had such high criteria for ourselves.
During the first half of 2013 we wrote a few posts here and there but didn't quite get into the routine of writing. The new site in September 2013 and visiting the travel blogger conference TBEX got us excited about blogging again. We got little more focused with the categories, but were still bit unclear what we wanted to write about.
Only recently we have gotten to the routine of writing. The weekly updates give us a rhythm which we can then spice up with another post or two about something else. Our goal now is to publish at least two posts every week. Writing is becoming easier for us all the time, by every post we publish.
Conclusions
So what did I learn by looking at these graphs? The first thing I saw was the three different periods, or gears, as I mentioned in the beginning. Then I saw the Twitter numbers and realized that I have no idea what Mirje is tweeting besides the links to our blog posts. The third one that striked me was how long did it take for us to become comfortable blogging and to build a daily writing routine. One and half years! We can see that our social activity online has doubled since last Summer, and it's affecting our life offline as well.
What do you see in these statistics? If you've been following us for a longer time, did you notice the changes I pointed out in this post when they happened?

We are Mirje and Antti, a 30+ digital nomad couple, entrepreneurs with restless feet and passion for experiencing the world. more »


